THE PROCESS

How the automated café works — from first call to first cup.

A clear process — typically 30 to 60 days from consultation to launch.

01

Consultation & Site Assessment

SIPJOLT team assessing a property location

We visit your space and find the perfect spot.

It starts with a conversation. We visit your property, inspect the layout, and use our market data to identify the highest-traffic location for your machine. No guesswork — just data-driven placement.

What we assess

Foot traffic patterns

Optimal placement

Utility requirements

What you provide

A standard outlet

A small storage closet

A utility sink

02

Delivery & Installation

SIPJOLT machine being installed in a property

We ship, install, and calibrate — at zero cost.

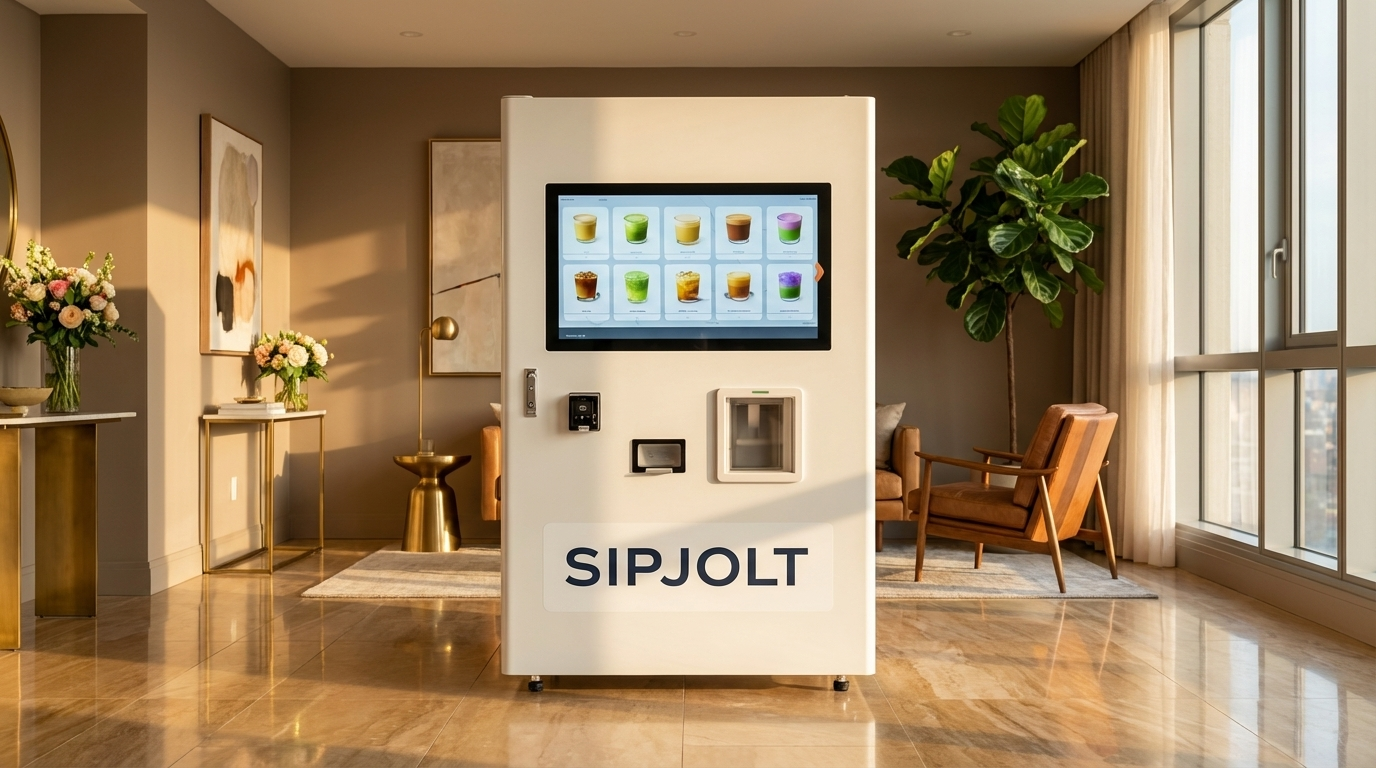
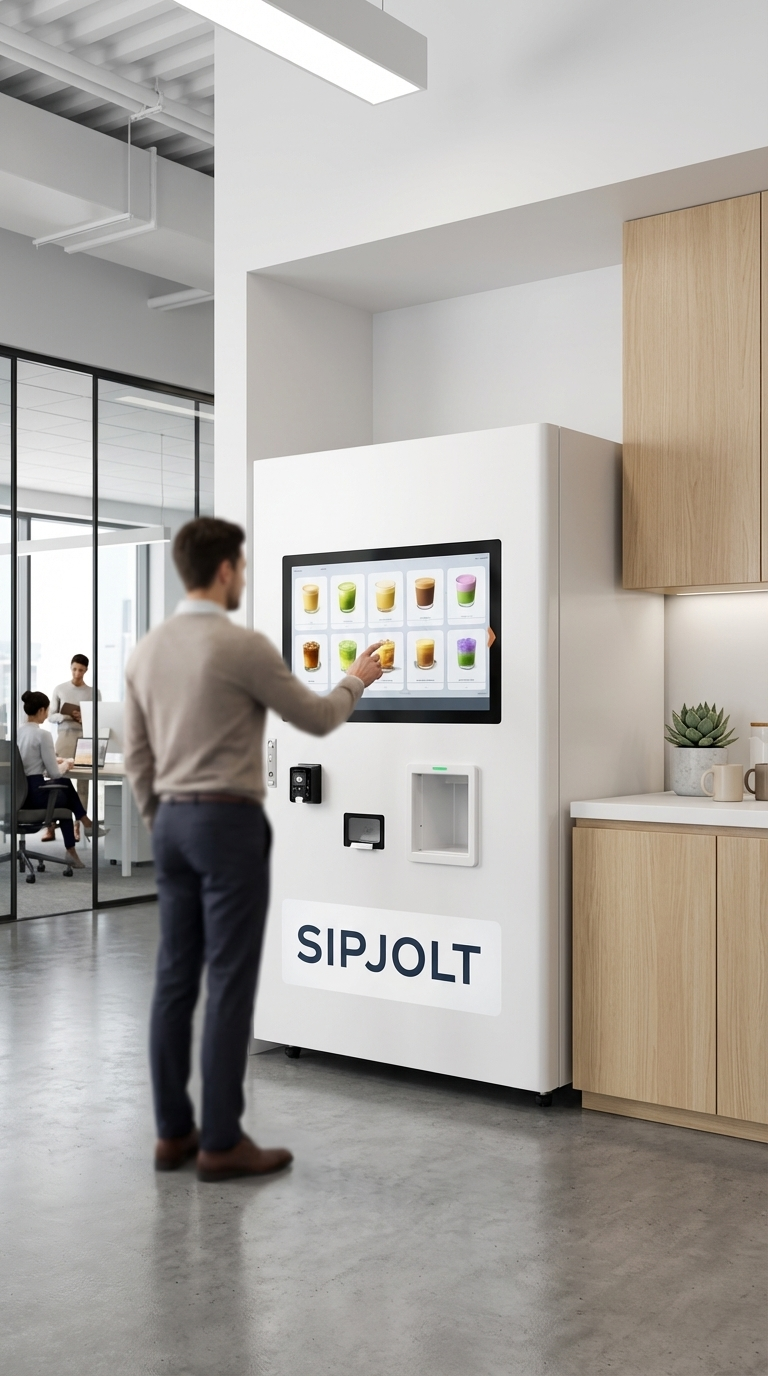
Typically 30 to 60 days from first conversation to launch. We handle the full shipment, installation, and calibration. No construction required. Your machine arrives stocked with premium ingredients including matcha, milk teas, espresso, and more — ready to serve. Explore our full menu of 200+ drinks.

We bring

The machine (free)

All ingredients

Full setup & calibration

The experience

200+ drinks from day one

Hot or iced, oat or dairy

Under 60 seconds per drink

03

Ongoing Partnership

You choose your level of involvement.

We work in all different configurations. We can handle everything, and some partners prefer to be more hands-on — our guided maintenance app makes it simple either way. You get a real-time analytics dashboard, quarterly revenue deposits, and seasonal menu updates pushed automatically.

Flexible operations

We can handle restocking

Or your team manages with our app

We supply all ingredients

Analytics & revenue

Real-time traffic insights

Peak hours & popular drinks

Quarterly deposits

TIMELINE

30 to 60 days from first call to first cup.

Week 1 — Initial conversation & site visit.

Week 2–4 — Location analysis & logistics planning.

Week 4–8 — Shipment, installation & launch.

Day 1 Live — First drinks served. Analytics begin.

ANALYTICS & INSIGHTS

Learn more about your space than ever before.

Foot Traffic Data

See exactly when people use your space. Our dashboard reveals foot traffic patterns, peak hours, and daily trends — data most properties never had access to.

Popular Drinks

Know what your residents, employees, or guests actually want. Drink popularity data by category, time of day, and season.

Space Utilization

Understand how your common areas perform. Usage data helps you make smarter decisions about amenities, layout, and programming.

Revenue Tracking

Real-time revenue data with cup counts, revenue share breakdown, and trend analysis. Full transparency, always.

Seasonal Trends

Track how seasonal menu rotations impact engagement. See which flavors drive the most traffic and repeat visits.

Quarterly Reports

Comprehensive performance reports delivered quarterly alongside your revenue deposit. Everything in one place.

Ready to see it in your space?

Free installation. Revenue from day one. Analytics that help you understand your space. Learn more about our building partnerships.

Get Started